BADGE Report (November 25, 2002)
Outcome Prediction
The complete database comprises 21 expression measurements of 12625 genes, 13 in the first condition and 8 in the second condition. The recorded expression values range between 0.01 and 9910.90.
Data were analyzed using BADGE (Bayesian Analysis of Differential Gene Expression) version 1.0 (1), a computer program implementing a Bayesian appraoch to identify differentially expressed genes across experimental conditions. For each gene, the method computes the posterior probability that the gene is expressed more than one fold in the first condition than in the second condition. This posterior probability is computed as the weighted average of the posterior probability computed under the assumption that the observations are generated by a Gamma distribution and a Log-normal distribution.
A predictive evaluation of the results obtained by this method was performed using leave-one-out cross validation. This techique consists of removing from the database one case at the time, estimating the model parameters from the remaining cases, and predicting the condition of the removed case on the basis of the selected genes and the parameters estimated from the remaining cases. If the condition predicted correponds to the condition of the predicted case, the prediction will be considred correct. If it does not, it will be taken as incorrect. The reproducibility of the results was assessed by computing the difference between the posterior probabilities of the genes identified by the same Description.
Using the approach described in the Methods section, we selected the genes with more than 999000.00% and less than 500.00% probability of being more expressed in the first condition, for a total of 8 and 0 genes in the first and the second case, respectively. Figure 1 displays the distribution of the probabilities of all genes in the dataset.
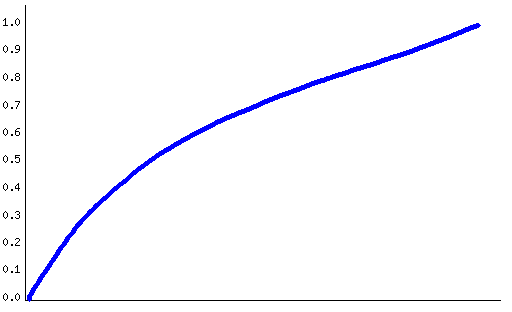 |
Figure 1. Distribution of the posterior probability of being differentially expressed for each gene in the dataset.
|
Figure 2 displays a colormap of the selected genes.
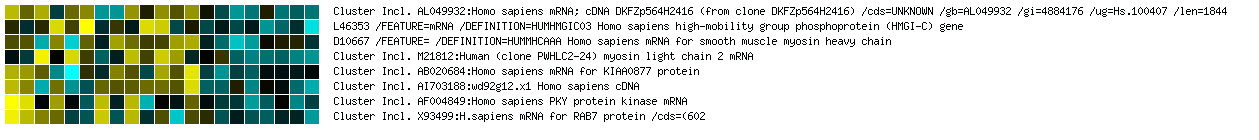 |
Figure 2. A colormap of the genes selected by the analysis. The intensity of each color denotes the standardized ratio between each value and the estimated average expression of each gene. click here to see an enlarged version.
|
Leave one out cross validation achived an accuracy of 100.00%.
Figure 3 displays the distribution of the distances between the posterior probabilities of differential expression of genes sharing the same Description.
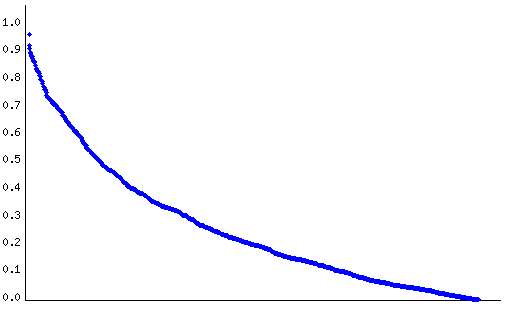 |
Figure 3. Distribution of the distances between the posterior probabilities of differential expression of genes sharing the same Description. Red dots denote distances exceeding the difference between the maximum and the minumum posterior probability of differential expression.
|
The average distance between genes with the same Description was 0.26, with a minumum and a maximum distance of 0.00 and 0.97, respectively.
| 1. |
Sebastiani, P and Ramoni, M (2002). Bayesian Analysis of Differential Gene Expression. Under review. |
This report was generated by BADGE v1.0.